Tracking my Performance
I decided to track my performance as a server so that I can see the raw numbers and compare them to what happened during the shift. This will most likely be a permanent project on my page, however it will be updated as time goes on/if and when I change jobs. I feel like this will help me learn where I can do better and what things I don't need to put as much focus on as I'm already doing them well. Also, as a baseline, I average 4-8 tables a night.
Here, I have put in my performances for my last 7 shifts in Excel. I have noticed that I tend to stay relatively consistent across the board except for when I serve more than 20 people. These days that I served more than 20 people were weekends, however on November 2nd I served a lot more children than on the 7th, which made my PPA dip.
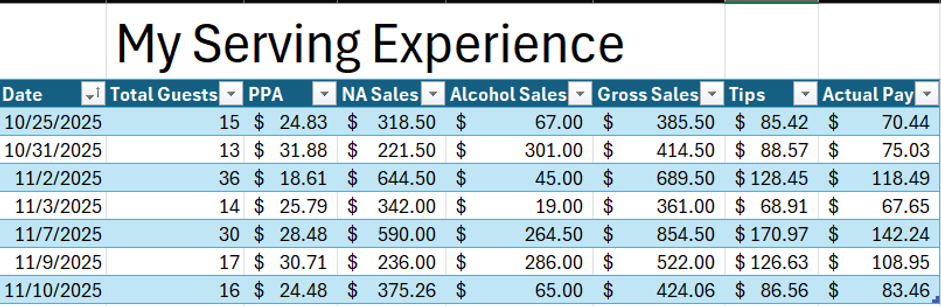

After looking at my raw numbers, I decided to do some theoretical work and add a calculator that will show me exactly how much I will personally be paid based off of # of Server's Assistants, Alcohol Sales, and Non-Alcohol Sales. It's not really tracking anything, but it is nice to have an idea of what I'm going to get paid before I do so.
Expected Pay = Tips- [$5(# of SA's) + 0.04(Alcohol Slales) + 0.035(Non-Alcoholic Sales)]
All of this is Tip out
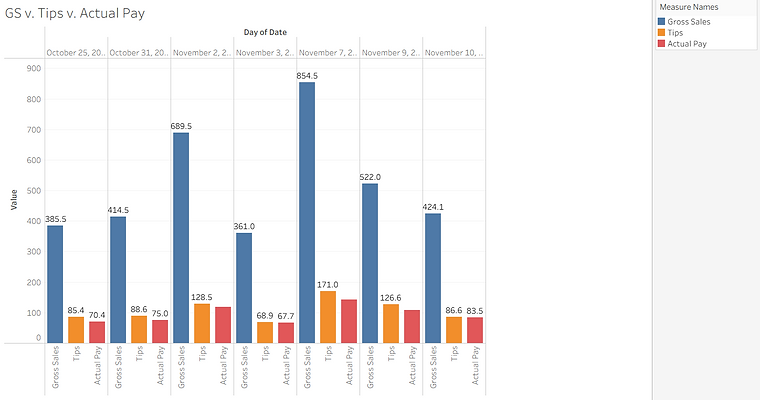
Here I used Tableau to draw a comparison of my Gross Sales, Tips, and Actual Pay. If you notice, regardless of day, when my Gross Sales are higher, it results in a bigger difference between my Tips and my Actual Pay. This is most likely due to higher Alcohol Sales, which means that I need to make sure I have enough Non-Alcoholic Sales to compensate since the tip out is lower.
I also observed that I stay relatively consistent with my Gross sales other than if I'm working a classically busy shift such as Sunday brunch or Saturday night. This shows that I am in a good spot and if I were to upsell more, I should have an even increase in everything across the board.
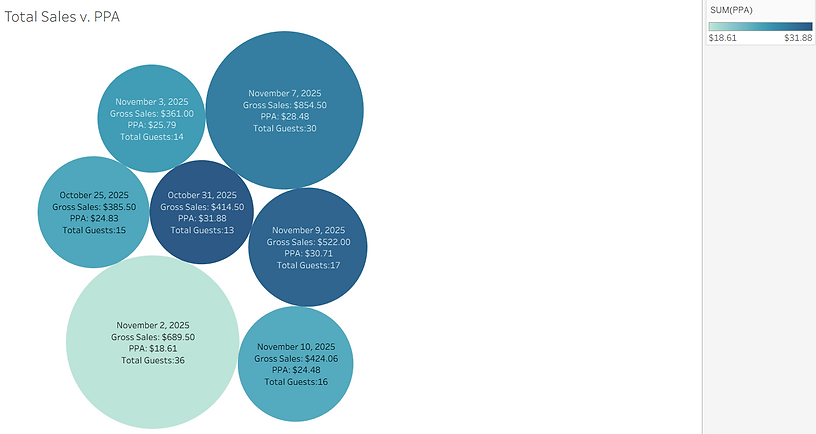
Here I wanted to compare my Gross Sales to my PPA to see if they stayed consistent, and to my surprise they did! The only one that is an outlier is November 2nd, which I distinctly remember serving a lot of kids that shift. This visualization showed me that I don't need to worry about my PPA unless I happen to serve more children. This also tells me that serving more people will lead to a consistent increase in Gross Sales, Tips and (hopefully) Actual Pay.
With this tracking I have done, I can conclude that I am doing good and am staying relatively consistent, however, I would like to now either serve more people or upsell more. I would also like to mention that I wanted to include my reviews to see if that draws anything interesting, but I have found that I have a 95% success rate of getting a 5-Star review (the other 5% being if they don't take the receipt with them) regardless of tip. That led me to believe that my reviews and tips don't have much of a correlation.